
Topic: Planetary Wind And Moisture Belts In The Troposphere
Planetary Wind And Moisture Belts In The Troposphere
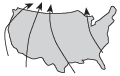
The map below shows a position of the polar jet stream over North America in January.
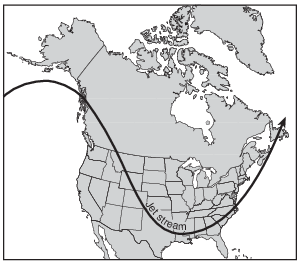
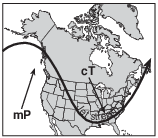
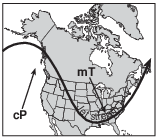
Which map best shows the air-mass movements associated with this jet stream position?
(1) 
(2) 
(3) 
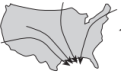
(4) 
Which map shows normal paths followed by low-pressure storm centers as they pass across the United States?
(1) 
(2) 
(3) 
(4) 
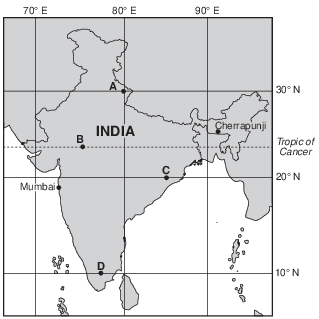
Monsoons in India
A monsoon season is caused by a seasonal shift in the wind direction, which produces excessive rainfall in many parts of the world, most notably India. Cherrapunji, in northeast India, received a record 30.5 feet of rain during July 1861. During the monsoon season from early June into September, Mumbai, India averages 6.8 feet of rain. Mumbai’s total average rainfall for the other eight months of the year is only 3.9 inches.
Monsoons are caused by unequal heating rates of land and water. As the land heats throughout the summer, a large low-pressure system forms over India. The heat from the Sun also warms the surrounding ocean waters, but the water warms much more slowly. The cooler air above the ocean is more dense, creating a higher air pressure relative to the lower air pressure over India.
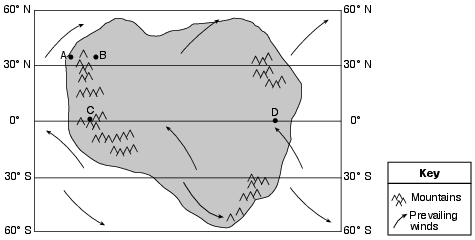
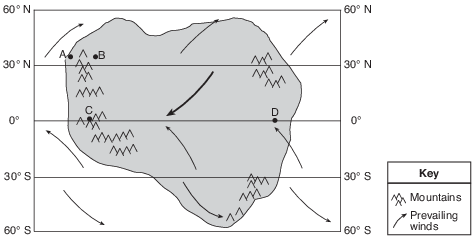
At which map location would no shadow be cast by the vertical stick at solar noon on the first day of summer?
(1) A
(2) B
(3) C
(4) D
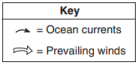
Which diagram correctly represents the curving of Earth’s ocean currents and prevailing winds due to the Coriolis effect?
(1) 
(2) 
(3) 
(4) 
Dry areas caused by sinking air and diverging surface winds are located at which two latitudes?
(1) 0° and 30° N
(2) 0° and 60° S
(3) 30° N and 30° S
(4) 60° N and 60° S
The graph below shows the relationship between the distance that wind blows over a body of water and the height of the waves that are generated.
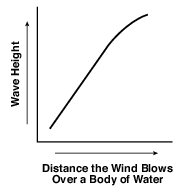
A west wind blowing with the same velocity would generate the highest waves along the shoreline at
(1) Jamestown
(2) Oswego
(3) Plattsburgh
(4) Riverhead
The planetary surface winds and air currents near Earth’s equator are usually
(1) converging and sinking
(2) diverging and sinking
(3) converging and rising
(4) diverging and rising
The arrows in the diagram below show changes in the direction of surface winds at four lettered locations, A, B, C, and D, on Earth.
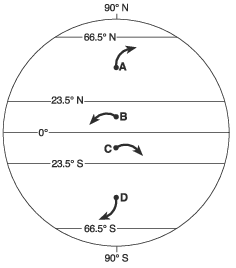
The arrow at which location correctly shows a deflection of the wind that could be due to the Coriolis effect?
(1) A
(2) B
(3) C
(4) D
Near which two latitudes are most of Earth’s dry climate regions found?
(1) 0° and 60° N
(2) 0° and 30° S
(3) 30° N and 60° N
(4) 30° N and 30° S
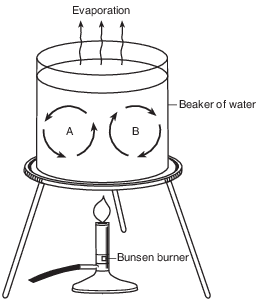
On the diagram in the image below, draw six arrowheads, one on each of the curved lines of the convection cells, to indicate the direction of water movement around letters A and B. [1]
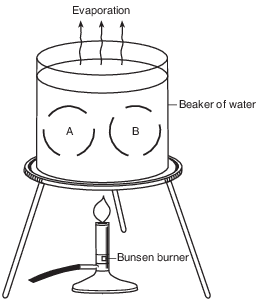
Allow 1 credit if all six arrowheads are drawn anywhere on each line to indicate the correct direction of water movement around letters A and B.
• Note: Allow credit if the student does not use the lines given in the diagram, but draws arrows
• around A and B to accurately show convection within the beaker.
• If more than six arrowheads are drawn, all must be correct to receive credit.
• Example of a 1-credit response:
• 
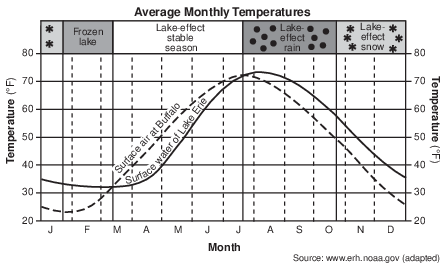
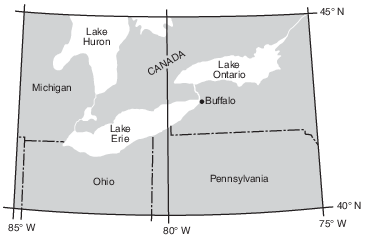
Great Lake Effects The Great Lakes influence the weather and climate of nearby land regions at all times of the year. Much of this lake effect is determined by the relative temperatures of surface lake water compared to the surface air temperatures over those land areas. The graph below shows the average monthly temperature of the surface water of Lake Erie and the surface air temperature at Buffalo, New York.
In an average year, four lake-effect seasons are experienced. When surface lake temperatures are colder than surface air temperatures, a stable season occurs. The cooler lake waters suppress cloud development and reduce the strength of rainstorms. As a result, late spring and early summer in the Buffalo region tends to be very sunny.
A season of lake-effect rains follows. August is usually a time of heavy nighttime rains, and much of the rainy season is marked by heavy, localized rainstorms downwind from the lake. Gradually, during late October, lake-effect rains are replaced by snows. Generally, the longer the time the wind travels over the lake, the heavier the lake effect becomes in Buffalo.
Finally, conditions stabilize again, as the relatively shallow Lake Erie freezes over, usually near the end of January. Very few lake-effect storms occur during this time period.
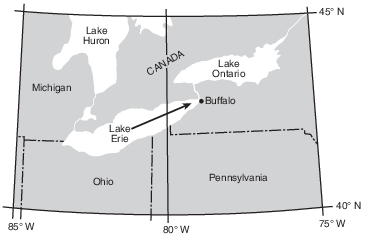
On the map in the image below, draw one straight arrow in Lake Erie to show the winter wind direction most likely to bring the heaviest lake-effect snows to Buffalo. [1]
Allow 1 credit for any arrow drawn from a southwest to northeast orientation on Lake Erie pointing toward Buffalo.
• Note: Allow credit even if the arrow extends before Lake Erie or beyond Buffalo. If additional
• arrows are drawn, they need not be over Lake Erie, but must have a general SW to NE direction.
• Example of a 1-credit response:
• 
On the map in the image provided, draw one curved arrow between 0° and 30° N to indicate the direction of prevailing planetary winds between these latitudes. [1]
Allow 1 credit for an arrow drawn curving to the right from northeast to southwest between 30° N and 0°.
• Note: If more than one curved arrow is drawn, all must be correctly drawn to receive credit.
• Example of a 1-credit response:
• 
Two South American Deserts
South America is an excellent example of the influence that plate tectonic features have on climates. The Andes mountain range, formed by plate tectonics, is on the western edge of South America. When prevailing winds come from the southeast, which usually occurs between 0° and 30° S latitudes, rainfall is increased on the eastern side of the mountain range. The Atacama Desert lies in the rain shadow (dry area) to the west of the mountains. Farther south, the reverse pattern is found, due to different prevailing winds blowing between 30° S and 60° S latitudes. The Patagonian Desert lies on the eastern side of the Andes, between the Andes and the South Atlantic Ocean.

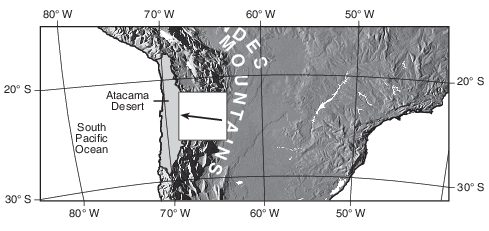
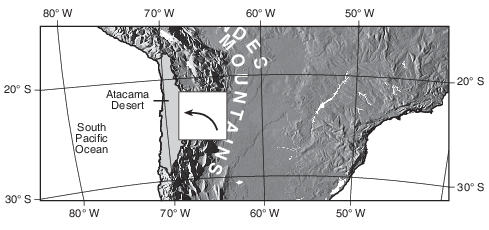
On the map in the image provided, draw one arrow in the box located on the Andes Mountains to indicate the surface planetary wind direction that helped produce the Atacama Desert. [1]
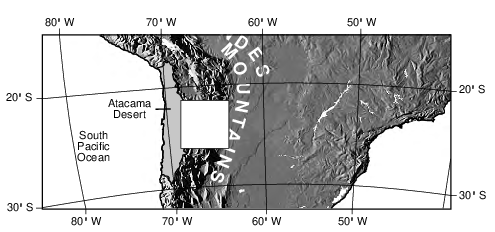
Allow 1 credit for a straight or curved arrow drawn generally pointing toward the west or northwest.
• Note: If more than one arrow is drawn, all must be correct to receive credit.
• Examples of 1-credit responses:
• 
•
• 

State the altitude of Polaris as seen by an observer on Slide Mountain. [1]
°
Allow 1 credit for 42°.
• Note: Do not allow credit if a compass direction is given (e.g., 42 N or 42° N) because that
• indicates latitude, not altitude.
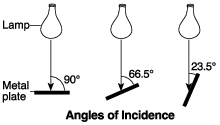
A student was interested in how the angle of insolation affects absorption of radiation. The student took three black metal plates, each containing a built-in thermometer, and placed them at the same distance from three identical lamps. The plates were tilted so that the light from the lamps created three different angles of incidence with the center of the plates, as shown in the diagram. The starting temperatures of the plates were recorded. The lamps were turned on for 10 minutes. Then the final temperatures were recorded.
The metal plate at a 90° angle of incidence represents a location on Earth at solar noon on March 21. What is the latitude of this location? [1]
Allow 1 credit for 0° latitude or the equator.